

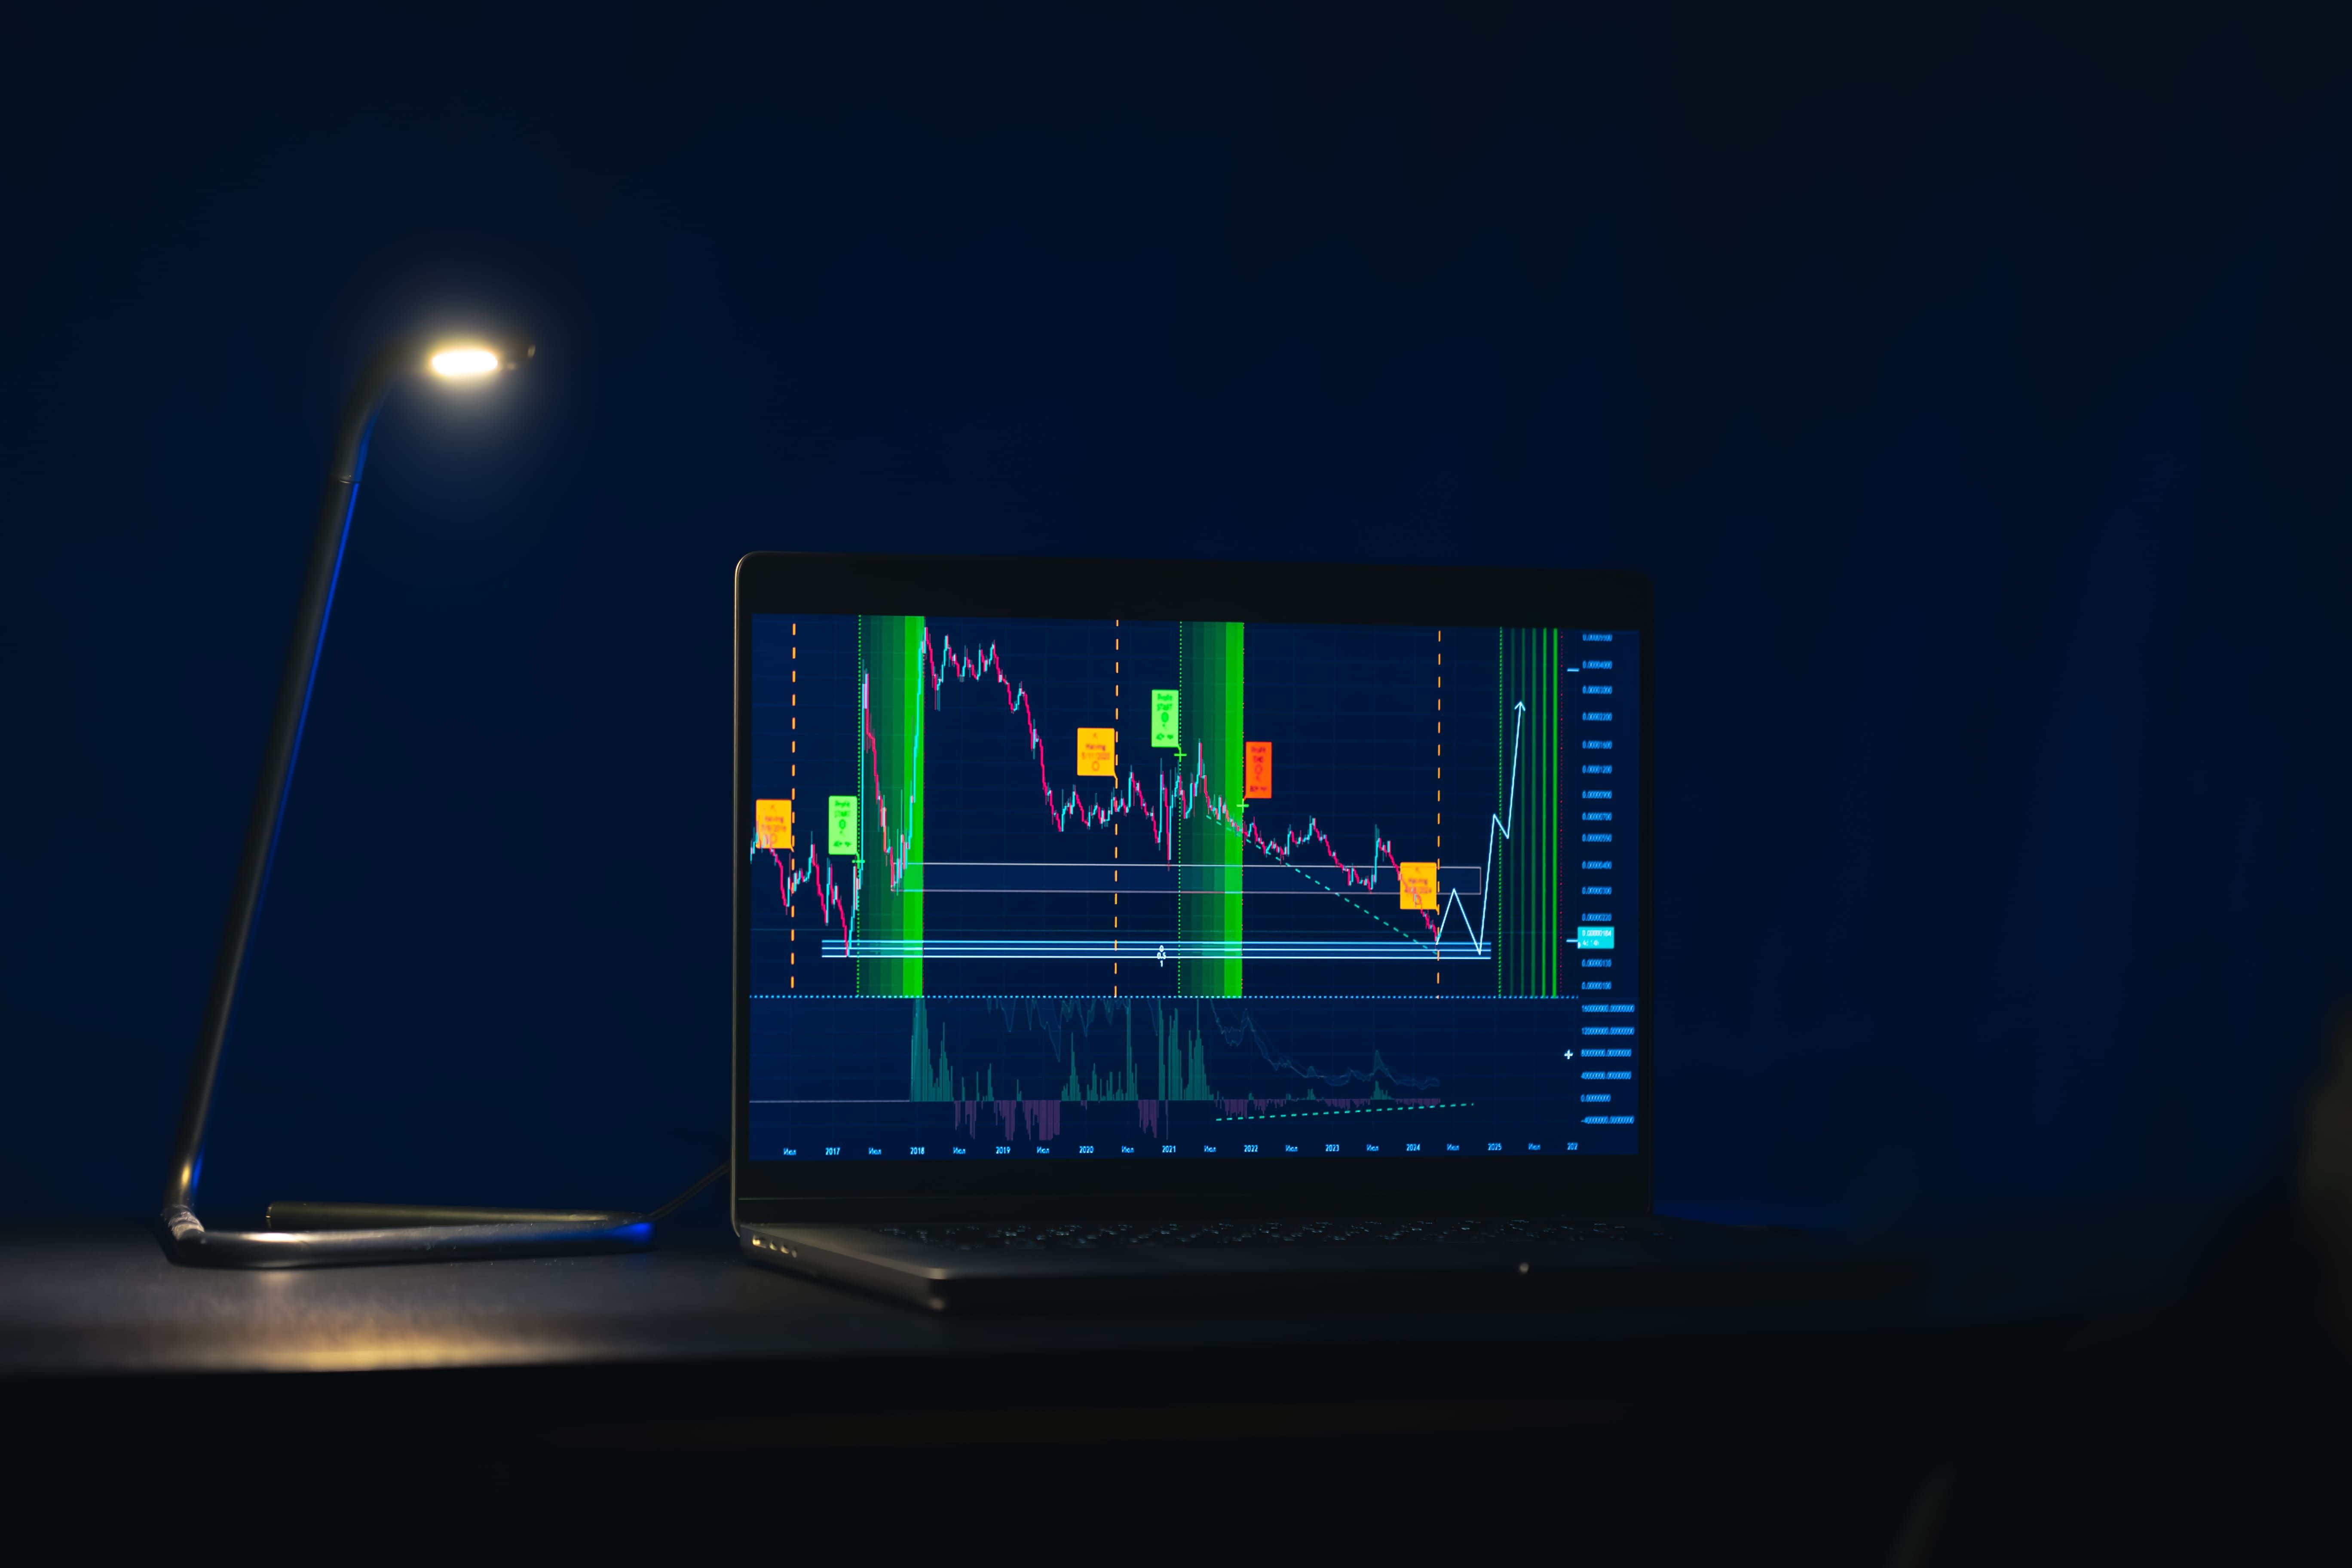
Start With the Candlestick Because It Tells the Whole Story
Candlestick Patterns That Actually Matter
Timeframes and How to Use Them Together
Indicators on MT5: What to Use and Why?
How to Set Up Your MT5 Chart Properly?
The One Thing Most Traders Get Wrong About Charts
Quick Reference: MT5 Chart Reading Checklist
Final Thought
Disclaimer:
Most traders open MetaTrader 5 for the first time and feel like they walked into a cockpit with zero flight training. Screens full of candles, lines, numbers, and blinking prices. It looks complicated because no one taught them where to actually look first.
I have spent years working with forex traders at different levels, from complete beginners who just downloaded MT5 last week to intermediate traders trying to build a consistent edge. The number one problem is not strategy. It is chart literacy. Once you understand what the chart is actually telling you, everything else becomes easier.
This guide will teach you how to read MT5 charts the right way. No theory dump. Just what you need to know, explained simply.
Every candle on an MT5 chart represents one unit of time. On the H1 chart, each candle is one hour of price movement. On M15, it is fifteen minutes. On D1, it is one full trading day.
Each candle has four data points: the open price, the close price, the highest price reached, and the lowest price reached during that time. The body of the candle shows you the open and close. The thin lines above and below, called wicks or shadows, show you the high and low.
A green or white candle means price closed higher than it opened. Buyers were in control. A red or black candle means price closed lower than it opened. Sellers pushed it down.
Here is a simple example. Imagine the EUR/USD pair opens at 1.0800 on an hourly candle. During that hour, price climbs as high as 1.0830, drops to 1.0785, and closes at 1.0815. You will see a green candle with a body from 1.0800 to 1.0815, a wick above reaching 1.0830, and a wick below reaching 1.0785. That one candle tells you buyers won that hour but faced some selling pressure.
According to a 2025 survey by Finance Magnates, over 74% of retail forex traders use MT5 as their primary charting platform. The ones who perform better consistently are those who learned to read price action before relying on indicators.
Not every candle pattern is worth memorising. Focus on the ones that show up repeatedly and carry real weight.
A doji candle has a very small body, almost no difference between open and close. This shows indecision in the market. When a doji appears after a strong trend, it is often a warning that the move is losing momentum.
A hammer has a small body at the top and a long wick below. It shows that sellers pushed price down hard but buyers rejected it and pushed it back up before the candle closed. This is a bullish signal when it appears at the bottom of a downtrend.
An engulfing candle is when one candle's body completely covers the previous candle's body. A bullish engulfing at a support zone tells you buyers have taken over. A bearish engulfing at a resistance zone tells you sellers stepped in strong.
Dr. Brett Steenbarger, a trading psychologist who has worked with institutional traders for over two decades, puts it simply: "Price is the purest signal available. Indicators interpret price. Learn to read price itself first."
MT5 offers timeframes from M1 (one minute) all the way to MN (one month). Beginners make the mistake of randomly switching between them and getting confused. The right approach is multi timeframe analysis.
Here is how it works in practice. You use a higher timeframe to identify the overall trend and key levels. You use a lower timeframe to find your entry point.
For example, if you are a swing trader, you might open the D1 (daily) chart first. You see that EUR/USD has been trending upward for the past three weeks. Price is now pulling back to a previous support zone around 1.0750. This gives you the big picture context.
Next you drop to H4 (four hour). You want to see if price is showing signs of bouncing from that support area. You spot a hammer candle forming right at 1.0750.
Then you go to H1 (one hour) to time your entry. You wait for a bullish candle to confirm that buyers are taking over before entering.
This top down approach keeps your trades aligned with the bigger picture. A 2024 study published in the Journal of Trading and Finance found that traders using multi timeframe analysis had a 23% higher win rate compared to those using single timeframe strategies.
MT5 comes loaded with over 80 built-in indicators. Most of them are not necessary. Adding too many creates what traders call analysis paralysis. You end up seeing contradicting signals and doing nothing.
Start with three core indicators and understand them deeply.
Moving Averages are the most widely used indicator in forex trading. The 50 EMA and 200 EMA on the daily chart are watched by institutional traders worldwide. When price is above the 200 EMA, the market is generally in an uptrend. When the 50 EMA crosses above the 200 EMA, it is called a golden cross and signals bullish momentum. The opposite is called a death cross. These levels work because millions of traders are watching them at the same time, creating a self fulfilling dynamic.
RSI (Relative Strength Index) measures how overbought or oversold a market is on a scale of 0 to 100. Above 70 means the market may be overbought. Below 30 means it may be oversold. The key word is "may." RSI alone should never trigger a trade. Use it as a filter to avoid entering too late in a move. A 2025 Myfxbook data analysis showed that RSI divergence combined with a support or resistance level had a success rate above 60% in trending forex pairs.
Bollinger Bands show you the volatility of a market. The bands expand when volatility is high and contract when it is low. A contraction, called a squeeze, often precedes a strong move in either direction. When price touches the upper band during an uptrend with strong candles, it is not necessarily a sell signal. It can signal continuation.
To add any indicator on MT5, click Insert at the top, then Indicators, then select your category. You can also right click the chart and select Indicators List to manage what is already applied.
A clean chart setup saves you from distraction. Here is a quick setup I recommend for new traders.
Go to Tools and then Chart Setup. Set candlestick colors so green candles are clearly visible against red ones. Under the Colors tab, choose a dark background if you are trading for long hours since it reduces eye strain significantly.
Keep your chart with two moving averages (50 EMA and 200 EMA), RSI on a separate window below, and volume bars if you are trading major pairs. That is all you need to start building pattern recognition.
Drawing tools in MT5 are also useful for adding horizontal support and resistance lines. Click the crosshair icon on the toolbar or press Ctrl and F. Then drag horizontally across significant price levels where price reversed multiple times in the past.
They look for patterns first and context second. A hammer at a random price level means very little. A hammer at a key support zone that has held three times in the past is a completely different signal.
Context comes from asking three questions before every trade setup. Where is the overall trend on the higher timeframe? Is there a clear level of support or resistance nearby? Does the candlestick pattern confirm what the level is suggesting?
According to data from a 2026 retail trading report by Finance Magnates, traders who consistently asked "why here" before entering a trade showed a 31% reduction in impulsive losses over a six month period compared to those who only used indicator signals.
The chart is not a magic signal machine. It is a record of what buyers and sellers have done. Your job is to read that record and ask whether the same thing is likely to happen again based on the current context.
Before entering any trade, run through this mentally.
Check the daily chart trend first. Mark your key support and resistance levels. Drop to H4 and look for confluence. Is price near a level? Is there a candle pattern forming? Check your RSI reading. Is it in an extreme zone? Look at volume or spread. Avoid entering right before major news events. Then and only then, look at H1 or M30 for your actual entry timing.
This takes less than five minutes once it becomes a habit.
Chart reading is a skill, not a gift. It gets better every single week if you practice with intention. Spend fifteen minutes each day reviewing what happened on your watched pairs. Ask yourself what the chart told you before the move happened. Over time, patterns start jumping out before they fully form.
MT5 gives you every tool you need. The question is whether you understand what you are looking at.
This content is for educational and informational purposes only. Nothing in this article constitutes financial advice, investment advice, or a recommendation to buy or sell any financial instrument. Forex and CFD trading carries a high level of risk and is not suitable for all investors. Past performance of any strategy or indicator is not indicative of future results. Always trade with capital you can afford to lose and consult a licensed financial advisor before making any trading decisions.